QUASONIX CONNECTION Volume 1, Issue 1
3rd Generation RDMS™ Release 15 available now!

We are pleased to announce the latest release of software/firmware for our third-generation RDMS™. Here are just a few of the highlights:
- Best-Channel Selector improvements, including:
- Improved consistency across bit rates
- Front Panel and Browser Interface enhancements to indicate BCS status including current highest quality channel
- Tape Output (Pre-D) controls added to the Front Panel and Browser Interface to simplify feature usage
- RDMS™ update enhancements, including the ability to perform future updates (R16+) over the network or through local media utilizing a package file provided by Quasonix
- Improvements to Frequency Diversity operation
- Expansion of the RDMS™ API to include more controls
- Improved support for importing prior release receiver settings files
- And much more
We’re listening! Our product improvement roadmap is driven by input from you. The release notes for this update contain a full list of feature improvements. Please continue to let us know what we can do to improve the product to help you get the most out of your RDMS™. To receive the release notes and SD update card, if you have any questions about this update, or if you have suggestions for future enhancements, please contact support@quasonix.com.
Preview: The RDMS™ Status Logger

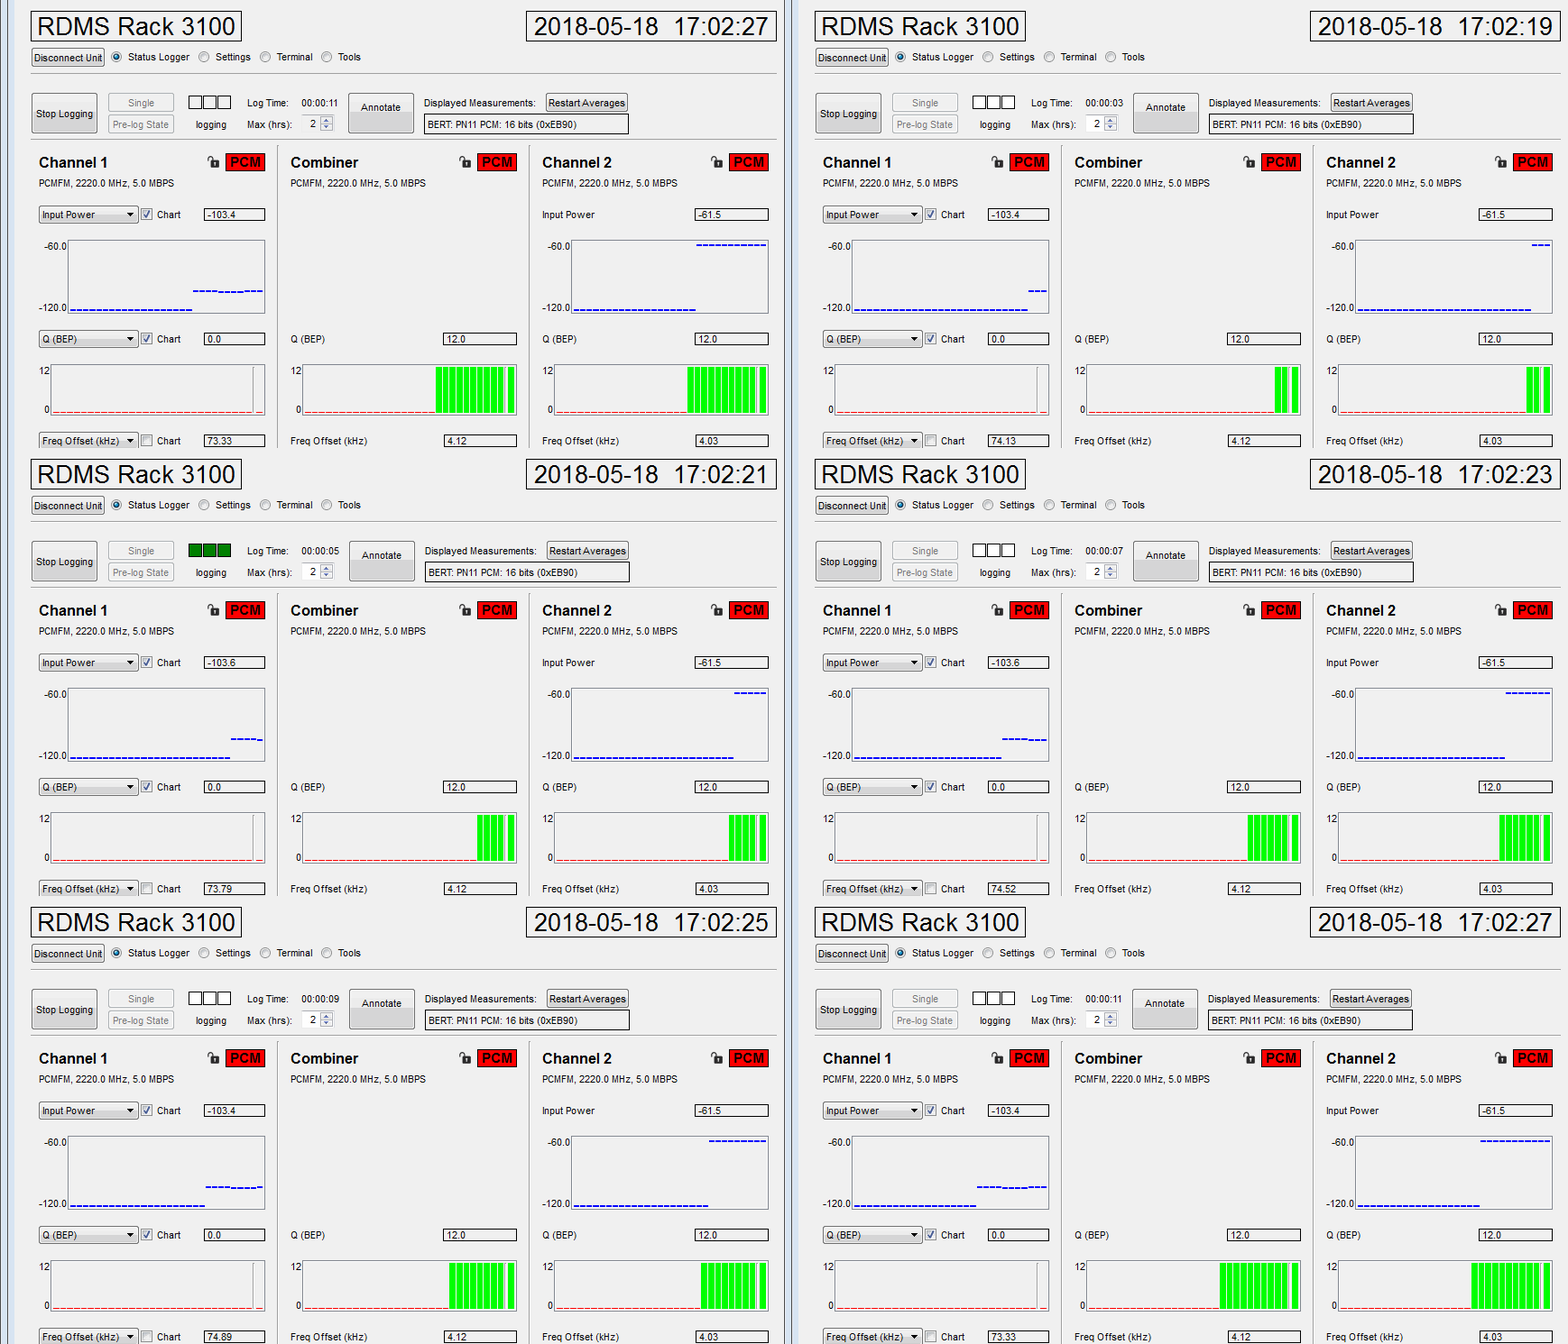
Need a powerful way to analyze receiver/demodulator mission dynamics? The Quasonix RDMS™ Status Logger is the solution. View metrics in a real-time graphics display and log status to a file. With two available configurations, the RDMS™ Status Logger is versatile AND easy to set up. Custom software provides a simple, intuitive tool to manage logging sessions. What other device can access the data, timestamp them, and log them to a PC hard drive or SD card, enabling unparalleled access to metrics for post-mission analysis? None that we know of.
Up to two times a second, the RDMSTM Status Logger accesses over 70 receiver measurements – including input power, EbN0, frequency offset, timing error, probability of bit error (PBE), and STC metrics – timestamps them, and logs them to a drive. Real-time graphics give a strip-chart style view of the data. This analysis may offer powerful insight into the telemetry behavior over the course of the mission.
Features include:
- A permanent record of all receiver settings is generated before and after logging
- Transparent to receiver operation
- Runs standalone (4 receivers) or on a host PC (using Serial Interface Module)
- Remote interface to standalone status logger over Ethernet, using VNC client
- Additional tools for telemetry analysis:
- Bitrate detector—scans input to determine the bit rate
- Spectral survey—surveys the input power seen by the receiver vs frequency
- Terminal for direct chat with receiver “bricks”

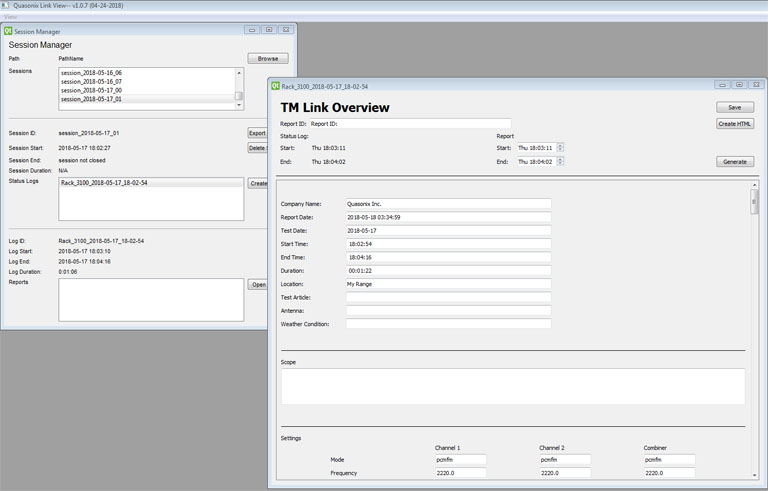
The LinkView application, included with the Status Logger system, provides a post-mission report generator, interactive charts, and data management for the status logger data. As the saying goes, “That which is measured, improves. That which is measured and reported improves exponentially.”

To learn more, check out the status logger product page or contact us at sales@quasonix.com.
Join us at DATT Summit

DATT Summit® 2018 is the place to connect with industry leaders within aerospace and defense and to expand your education to advance your career. And it’s right around the corner – June 4-7 in Orlando Florida. Check out the DATT Summit website to learn more (https://www.dattsummit.com), and visit us at booth 401!
Spread the word
Do you have colleagues who could benefit from this newsletter but haven’t signed up? Forward them a copy. It just takes a minute to subscribe at www.quasonix.com/quasonixconnection.
We’d love to hear from you
This newsletter is for you. What topics would you like us to cover in future issues? Please send your comments and suggestions to our editor.
